Example 5: Getting Turbine and Farm Power#
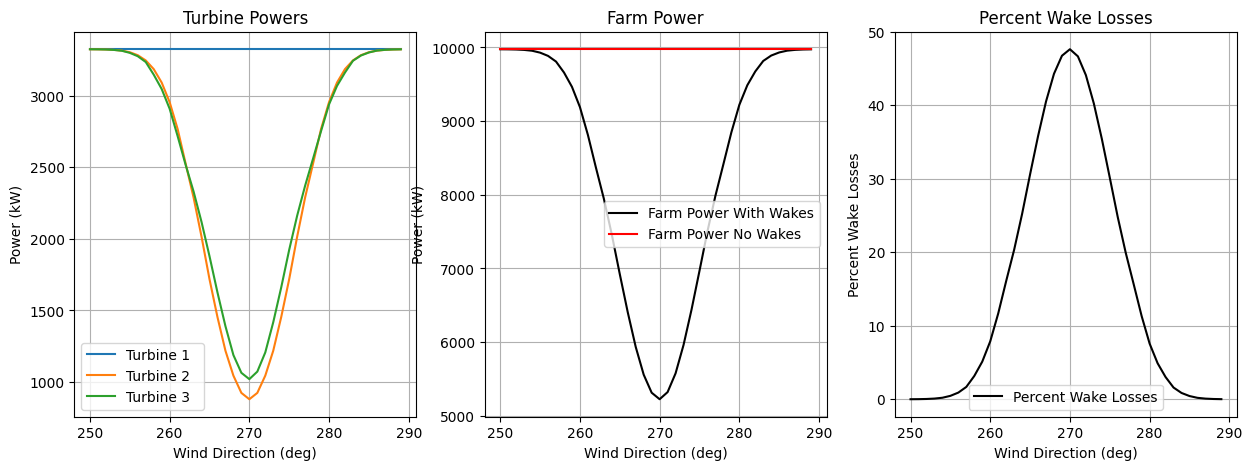
After setting the FlorisModel and running, the next step is typically to get the power outputof the turbines. FLORIS has several methods for getting power:1. get_turbine_powers(): Returns the power output of each turbine in the farm for each findex (n_findex, n_turbines)2. get_farm_power(): Returns the total power output of the farm for each findex (n_findex)3. get_expected_farm_power(): Returns the combination of the farm power over each findex with the frequency of each findex to get the expected farm power4. get_farm_AEP(): Multiplies the expected farm power by the number of hours in a year to get the expected annual energy production (AEP) of the farm
import matplotlib.pyplot as plt
import numpy as np

from floris import (
    FlorisModel,
    TimeSeries,
    WindRose,
)


fmodel = FlorisModel("inputs/gch.yaml")

# Set to a 3-turbine layout
fmodel.set(layout_x=[0, 126 * 5, 126 * 10], layout_y=[0, 0, 0])

######################################################
# Using TimeSeries
######################################################

# Set up a time series in which the wind speed and TI are constant but the wind direction
# sweeps the range from 250 to 290 degrees
wind_directions = np.arange(250, 290, 1.0)
time_series = TimeSeries(
    wind_directions=wind_directions, wind_speeds=9.9, turbulence_intensities=0.06
)
fmodel.set(wind_data=time_series)

# Run the model
fmodel.run()

# Get the turbine powers
turbine_powers = fmodel.get_turbine_powers()

# Turbines powers will have shape (n_findex, n_turbines) where n_findex is the number of unique
# wind conditions and n_turbines is the number of turbines in the farm
print(f"Turbine power has shape {turbine_powers.shape}")

# It is also possible to get the farm power directly
farm_power = fmodel.get_farm_power()

# Farm power has length n_findex, and is the sum of the turbine powers
print(f"Farm power has shape {farm_power.shape}")

# It's possible to get these powers with wake losses disabled, this can be useful
# for computing total wake losses
fmodel.run_no_wake()
farm_power_no_wake = fmodel.get_farm_power()

# Plot the results
fig, axarr = plt.subplots(1, 3, figsize=(15, 5))

# Plot the turbine powers
ax = axarr[0]
for i in range(turbine_powers.shape[1]):
    ax.plot(wind_directions, turbine_powers[:, i] / 1e3, label=f"Turbine {i+1}  ")
ax.set_xlabel("Wind Direction (deg)")
ax.set_ylabel("Power (kW)")
ax.grid(True)
ax.legend()
ax.set_title("Turbine Powers")

# Plot the farm power
ax = axarr[1]
ax.plot(wind_directions, farm_power / 1e3, label="Farm Power With Wakes", color="k")
ax.plot(wind_directions, farm_power_no_wake / 1e3, label="Farm Power No Wakes", color="r")
ax.set_xlabel("Wind Direction (deg)")
ax.set_ylabel("Power (kW)")
ax.grid(True)
ax.legend()
ax.set_title("Farm Power")

# Plot the percent wake losses
ax = axarr[2]
percent_wake_losses = 100 * (farm_power_no_wake - farm_power) / farm_power_no_wake
ax.plot(wind_directions, percent_wake_losses, label="Percent Wake Losses", color="k")
ax.set_xlabel("Wind Direction (deg)")
ax.set_ylabel("Percent Wake Losses")
ax.grid(True)
ax.legend()
ax.set_title("Percent Wake Losses")


######################################################
# Using WindRose
######################################################

# When running FLORIS using a wind rose, that is when a WindRose or WindTIRose object is
# passed into the set function.  The functions get_expected_farm_power and get_farm_AEP
# will operate the same as above, however the functions get_turbine_powers and get_farm_power
# will be reshaped from (n_findex, n_turbines) and
# (n_findex) to (n_wind_dir, n_wind_speed, n_turbines)
# and (n_wind_dir, n_wind_speed) respectively.  This is make the powers align more easily with the
# provided wind rose.

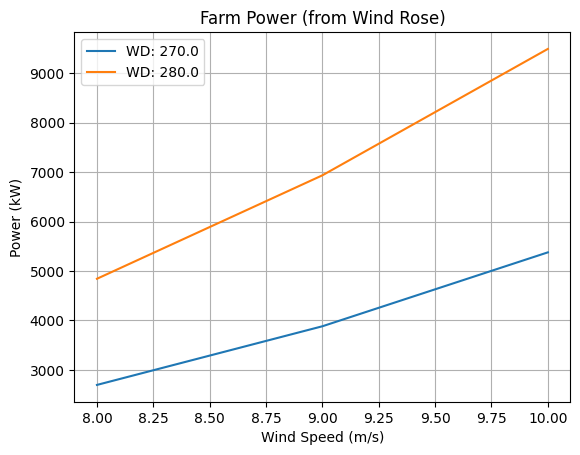
# Declare a WindRose object of 2 wind directions and 3 wind speeds and constant turbulence intensity
wind_rose = WindRose(
    wind_directions=np.array([270.0, 280.0]), wind_speeds=np.array([8.0, 9.0, 10.0]), ti_table=0.06
)

fmodel.set(wind_data=wind_rose)

print("==========Wind Rose==========")
print(f"Number of conditions to simulate (2 x 3): {fmodel.n_findex}")

fmodel.run()

turbine_powers = fmodel.get_turbine_powers()

print(f"Shape of turbine powers: {turbine_powers.shape}")

farm_power = fmodel.get_farm_power()

print(f"Shape of farm power: {farm_power.shape}")


# Plot the farm power
fig, ax = plt.subplots()

for w_idx, wd in enumerate(wind_rose.wind_directions):
    ax.plot(wind_rose.wind_speeds, farm_power[w_idx, :] / 1e3, label=f"WD: {wd}")

ax.set_xlabel("Wind Speed (m/s)")
ax.set_ylabel("Power (kW)")
ax.grid(True)
ax.legend()
ax.set_title("Farm Power (from Wind Rose)")

plt.show()
import warnings
warnings.filterwarnings('ignore')
Turbine power has shape (40, 3)
Farm power has shape (40,)
==========Wind Rose==========
Number of conditions to simulate (2 x 3): 6
Shape of turbine powers: (2, 3, 3)
Shape of farm power: (2, 3)


