Example: Specify turbine power curve#
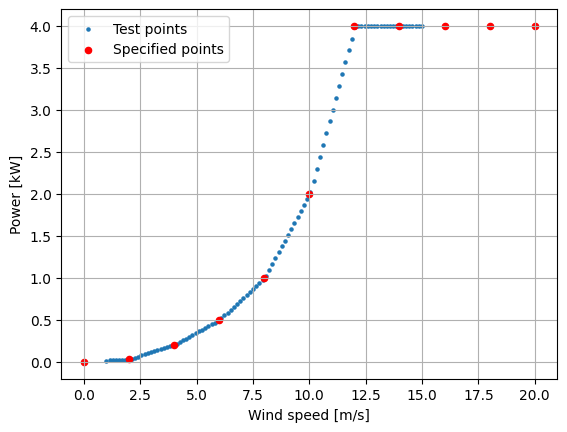
This example demonstrates how to specify a turbine model based on a powerand thrust curve for the wind turbine, as well as possible physical parameters(which default to the parameters of the NREL 5MW reference turbine).Note that it is also possible to have a .yaml created, if the file_pathargument to build_turbine_dict is set.
import matplotlib.pyplot as plt
import numpy as np

from floris import FlorisModel
from floris.turbine_library import build_cosine_loss_turbine_dict


# Generate an example turbine power and thrust curve for use in the FLORIS model
powers_orig = np.array([0, 30, 200, 500, 1000, 2000, 4000, 4000, 4000, 4000, 4000])
wind_speeds = np.array([0, 2, 4, 6, 8, 10, 12, 14, 16, 18, 20])
power_coeffs = powers_orig[1:] / (0.5 * 126.0**2 * np.pi / 4 * 1.225 * wind_speeds[1:] ** 3)
turbine_data_dict = {
    "wind_speed": list(wind_speeds),
    "power_coefficient": [0] + list(power_coeffs),
    "thrust_coefficient": [0, 0.9, 0.9, 0.8, 0.7, 0.6, 0.5, 0.4, 0.3, 0.25, 0.2],
}

turbine_dict = build_cosine_loss_turbine_dict(
    turbine_data_dict,
    "example_turbine",
    file_name=None,
    generator_efficiency=1,
    hub_height=90,
    cosine_loss_exponent_yaw=1.88,
    cosine_loss_exponent_tilt=1.88,
    rotor_diameter=126,
    TSR=8,
    ref_air_density=1.225,
    ref_tilt=5,
)

fmodel = FlorisModel("../inputs/gch.yaml")
wind_speeds = np.linspace(1, 15, 100)
wind_directions = 270 * np.ones_like(wind_speeds)
turbulence_intensities = 0.06 * np.ones_like(wind_speeds)
# Replace the turbine(s) in the FLORIS model with the created one
fmodel.set(
    layout_x=[0],
    layout_y=[0],
    wind_directions=wind_directions,
    wind_speeds=wind_speeds,
    turbulence_intensities=turbulence_intensities,
    turbine_type=[turbine_dict],
)
fmodel.run()

powers = fmodel.get_farm_power()

specified_powers = (
    np.array(turbine_data_dict["power_coefficient"])
    * 0.5
    * turbine_dict["power_thrust_table"]["ref_air_density"]
    * turbine_dict["rotor_diameter"] ** 2
    * np.pi
    / 4
    * np.array(turbine_data_dict["wind_speed"]) ** 3
) / 1000

fig, ax = plt.subplots(1, 1, sharex=True)

ax.scatter(wind_speeds, powers / 1000, color="C0", s=5, label="Test points")
ax.scatter(
    turbine_data_dict["wind_speed"], specified_powers, color="red", s=20, label="Specified points"
)

ax.grid()
ax.set_xlabel("Wind speed [m/s]")
ax.set_ylabel("Power [kW]")
ax.legend()

plt.show()
import warnings
warnings.filterwarnings('ignore')

