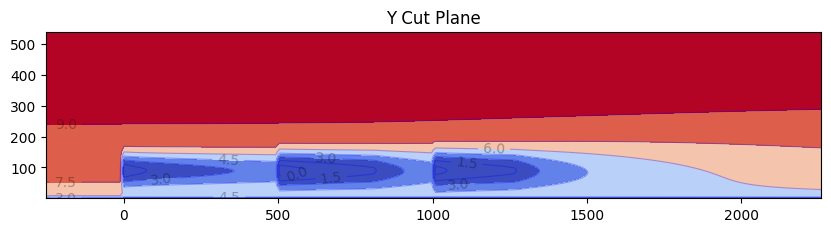
Example: Visualize y cut plane#
Demonstrate visualizing a plane cut vertically through the flow field along the wind direction.
import matplotlib.pyplot as plt

from floris import FlorisModel
from floris.flow_visualization import visualize_cut_plane


fmodel = FlorisModel("../inputs/gch.yaml")

# Set a 3 turbine layout with wind direction along the row
fmodel.set(
    layout_x=[0, 500, 1000],
    layout_y=[0, 0, 0],
    wind_directions=[270],
    wind_speeds=[8],
    turbulence_intensities=[0.06],
)

# Collect the yplane
y_plane = fmodel.calculate_y_plane(x_resolution=200, z_resolution=100, crossstream_dist=0.0)

# Plot the flow field
fig, ax = plt.subplots(figsize=(10, 4))
visualize_cut_plane(
    y_plane, ax=ax, min_speed=3, max_speed=9, label_contours=True, title="Y Cut Plane"
)

plt.show()
import warnings
warnings.filterwarnings('ignore')