import matplotlib.pyplot as plt
import numpy as np

from floris import (
    FlorisModel,
    TimeSeries,
    UncertainFlorisModel,
)


# Instantiate FlorisModel for comparison
fmodel = FlorisModel("../inputs/gch.yaml")  # GCH model

################################################
# Resolution parameters
################################################

# The resolution parameters are used to define the precision of the wind direction,
# wind speed, and turbulence intensity and control parameters.  All the inputs
# passed into the UncertainFlorisModel class are rounded to this resolution.  Then
# following expansion, non-unique cases are removed.  Here we apply the default
# resolution parameters.
wd_resolution = 1.0  # Degree
ws_resolution = 1.0  # m/s
ti_resolution = 0.01  # Decimal fraction
yaw_resolution = 1.0  # Degree
power_setpoint_resolution = 100.0  # kW

################################################
# wd_sample_points
################################################

# The wind direction sample points (wd_sample_points) parameter is used to define
# the number of points to sample the wind direction uncertainty.  For example,
# if the the single condition to analyze is 270 degrees, and the wd_sample_points
# is [-2, -1, 0, 1 ,2], then the cases to be run and weighted
#  will be 268, 269, 270, 271, 272.  If not supplied default is
# [-2 * wd_std, -1 * wd_std, 0, wd_std, 2 * wd_std]
wd_sample_points = [-6, -3, 0, 3, 6]


################################################
# WT_STD
################################################

# The wind direction standard deviation (wd_std) parameter is the primary input
# to the UncertainFlorisModel class.  This parameter is used to weight the points
# following expansion by the wd_sample_points.  The smaller the value, the closer
# the weighting will be to the nominal case.
wd_std = 3 # Default is 3 degrees

################################################
# Verbosity
################################################

# Setting verbose = True will print out the sizes of teh cases run
verbose = True

################################################
# Define the UncertainFlorisModel
################################################
print('*** Instantiating UncertainFlorisModel ***')
ufmodel = UncertainFlorisModel("../inputs/gch.yaml",
                               wd_resolution=wd_resolution,
                                 ws_resolution=ws_resolution,
                                    ti_resolution=ti_resolution,
                                    yaw_resolution=yaw_resolution,
                                    power_setpoint_resolution=power_setpoint_resolution,
                                    wd_std=wd_std,
                                    wd_sample_points=wd_sample_points,
                                    verbose=verbose)


################################################
# Run the models
################################################

# Define an inflow where wind direction is swept while
# wind speed and turbulence intensity are held constant
wind_directions = np.arange(240.0, 300.0, 1.0)
time_series = TimeSeries(
    wind_directions=wind_directions,
    wind_speeds=8.0,
    turbulence_intensities=0.06,
)

# Define a two turbine farm and apply the inflow
D = 126.0
layout_x = np.array([0, D * 6])
layout_y = [0, 0]

fmodel.set(
    layout_x=layout_x,
    layout_y=layout_y,
    wind_data=time_series,
)
print('*** Setting UncertainFlorisModel to 60 Wind Direction Inflow ***')
ufmodel.set(
    layout_x=layout_x,
    layout_y=layout_y,
    wind_data=time_series,
)

# Run both models
fmodel.run()
ufmodel.run()


# Collect the nominal and uncertain farm power
turbine_powers_nom = fmodel.get_turbine_powers() / 1e3
turbine_powers_unc = ufmodel.get_turbine_powers() / 1e3

farm_powers_nom = fmodel.get_farm_power() / 1e3
farm_powers_unc_3 = ufmodel.get_farm_power() / 1e3


# Plot results
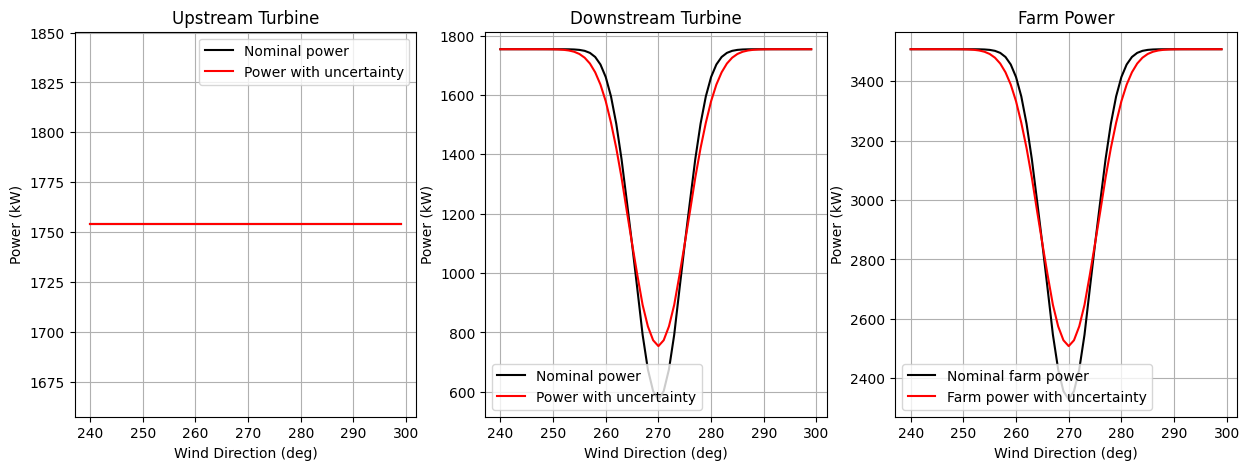
fig, axarr = plt.subplots(1, 3, figsize=(15, 5))
ax = axarr[0]
ax.plot(wind_directions, turbine_powers_nom[:, 0].flatten(), color="k", label="Nominal power")
ax.plot(
    wind_directions,
    turbine_powers_unc[:, 0].flatten(),
    color="r",
    label="Power with uncertainty",
)

ax.grid(True)
ax.legend()
ax.set_xlabel("Wind Direction (deg)")
ax.set_ylabel("Power (kW)")
ax.set_title("Upstream Turbine")

ax = axarr[1]
ax.plot(wind_directions, turbine_powers_nom[:, 1].flatten(), color="k", label="Nominal power")
ax.plot(
    wind_directions,
    turbine_powers_unc[:, 1].flatten(),
    color="r",
    label="Power with uncertainty",
)

ax.set_title("Downstream Turbine")
ax.grid(True)
ax.legend()
ax.set_xlabel("Wind Direction (deg)")
ax.set_ylabel("Power (kW)")

ax = axarr[2]
ax.plot(wind_directions, farm_powers_nom.flatten(), color="k", label="Nominal farm power")
ax.plot(
    wind_directions,
    farm_powers_unc_3.flatten(),
    color="r",
    label="Farm power with uncertainty",
)


ax.set_title("Farm Power")
ax.grid(True)
ax.legend()
ax.set_xlabel("Wind Direction (deg)")
ax.set_ylabel("Power (kW)")


plt.show()
import warnings
warnings.filterwarnings('ignore')

